- 1The view
- 2The stage, and how many deals sit in it
- 3One deal
- 4Weighted against gross, per stage
- The view
- The stage, and how many deals sit in it
- One deal
- Weighted against gross, per stage
Every pipeline can be viewed four ways. Switch with the VIEW button at the top of the Deals screen. The deals are the same; the shape changes to suit the task.
Board
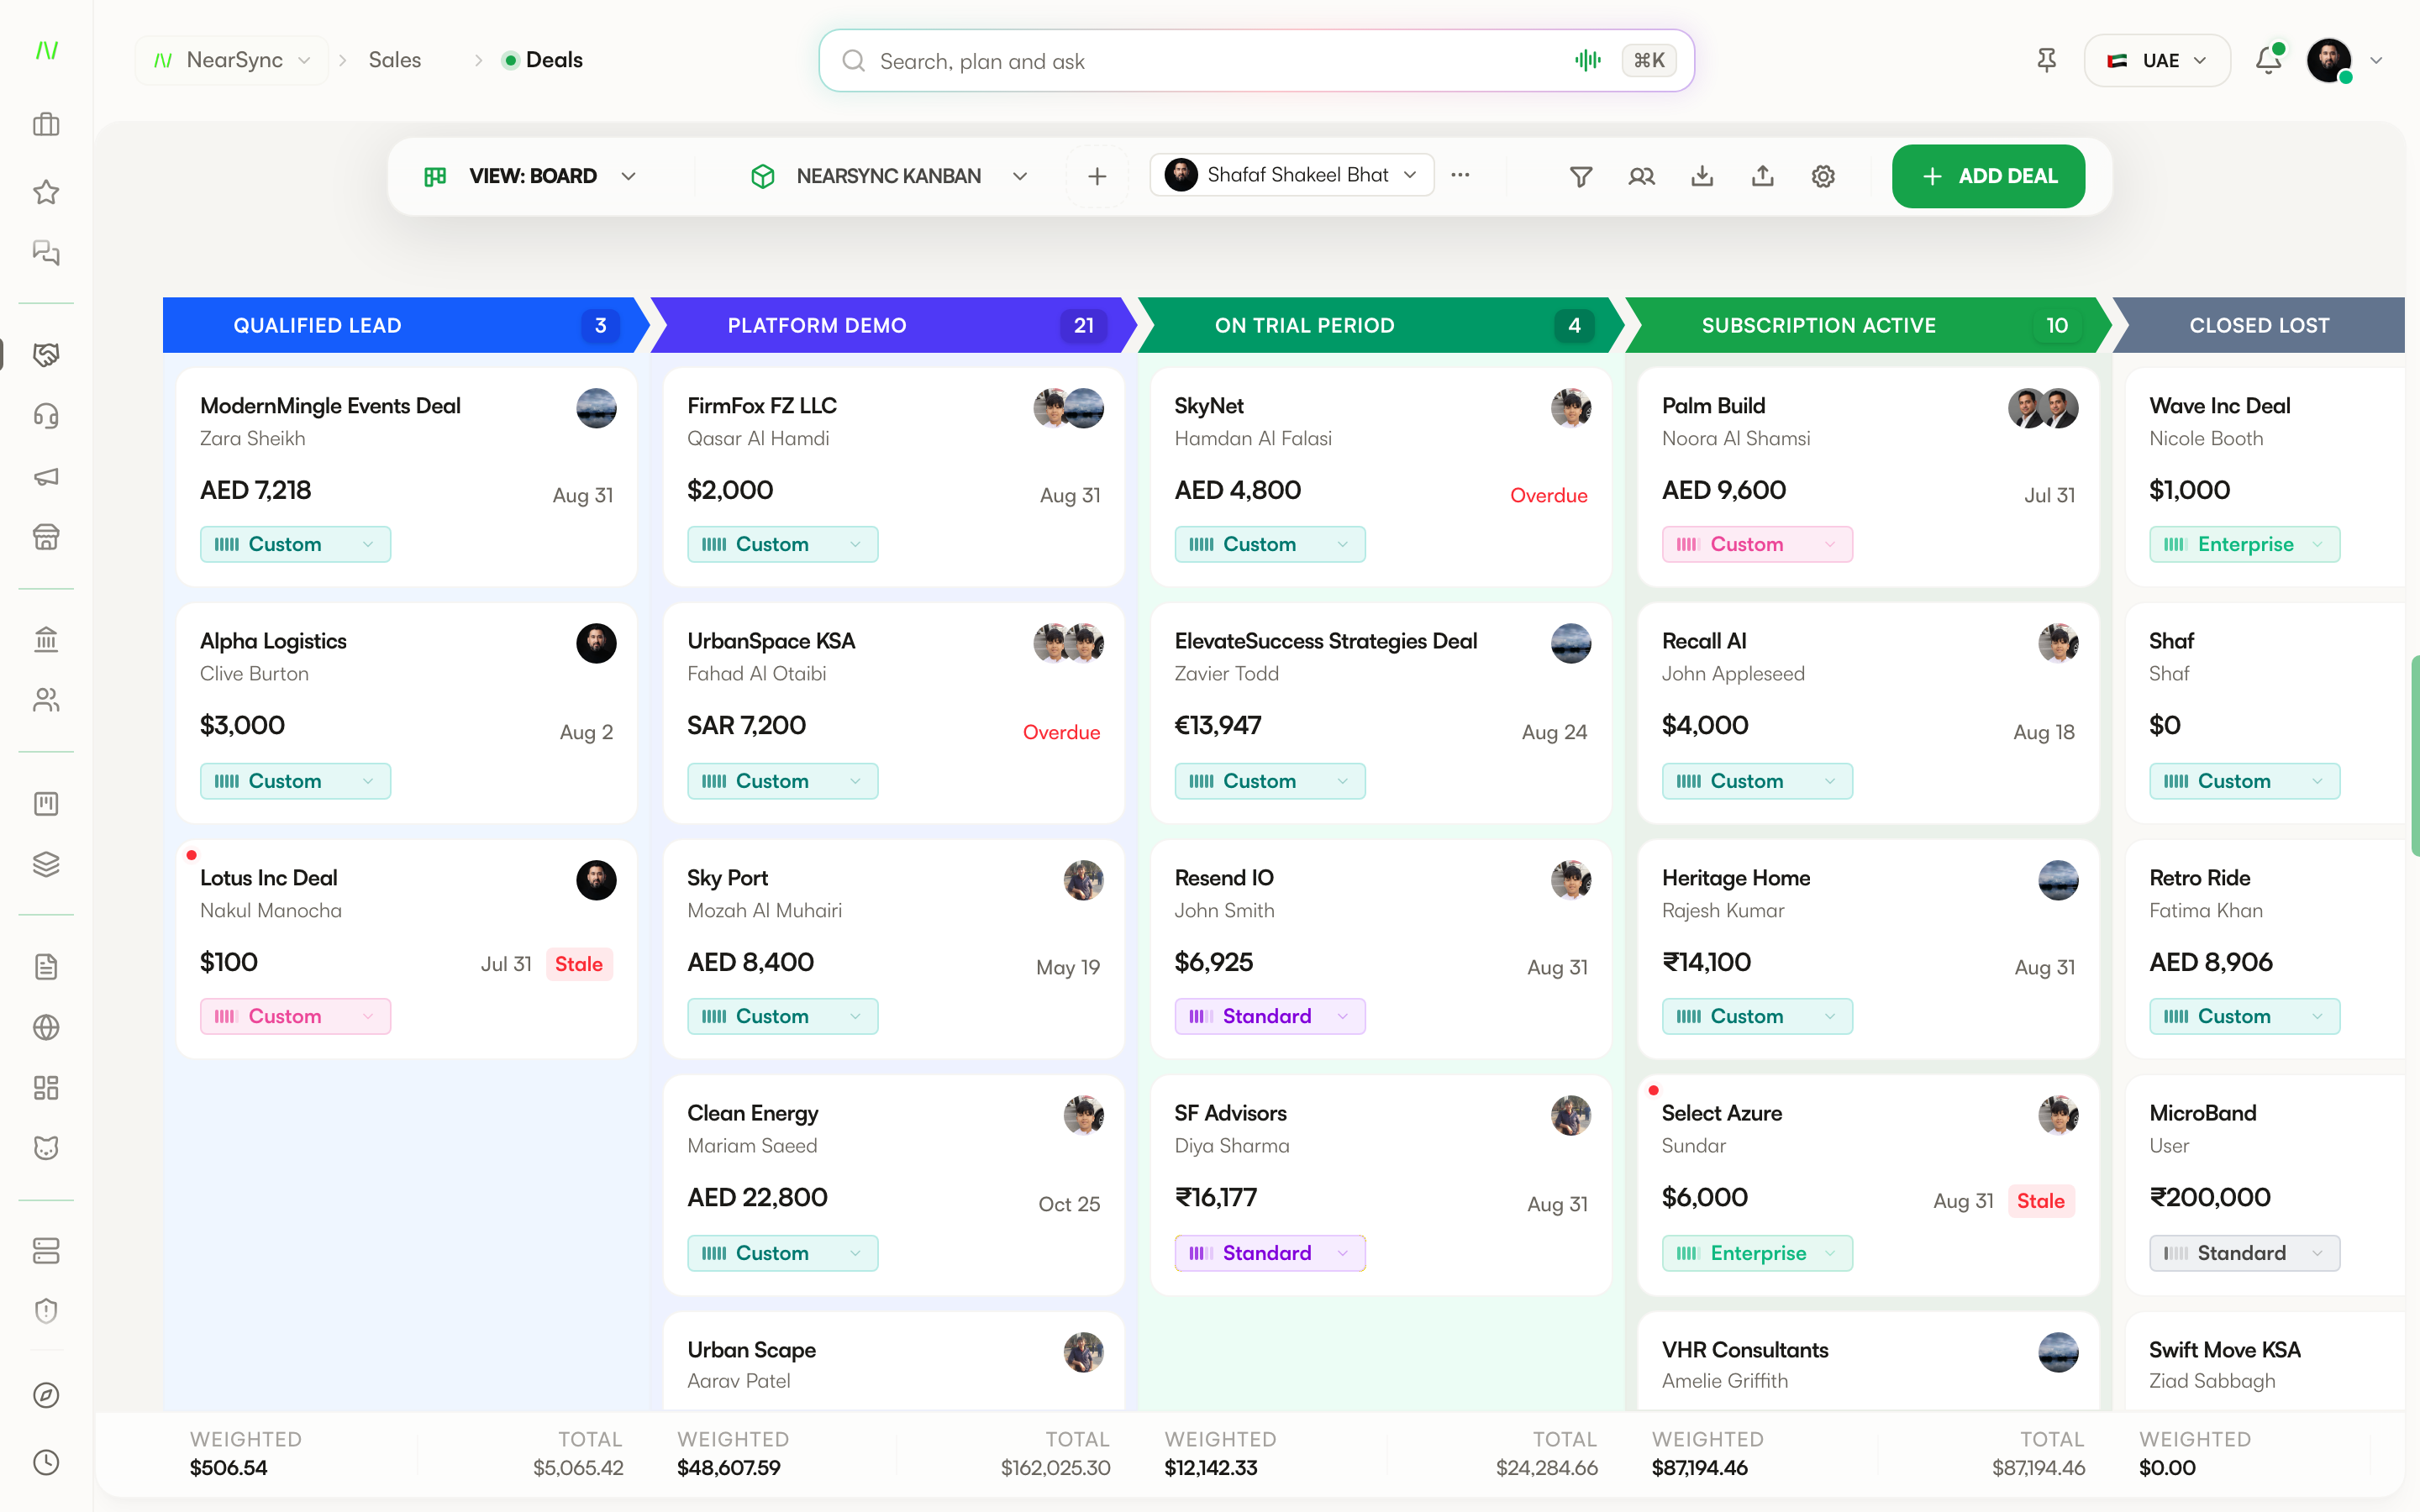
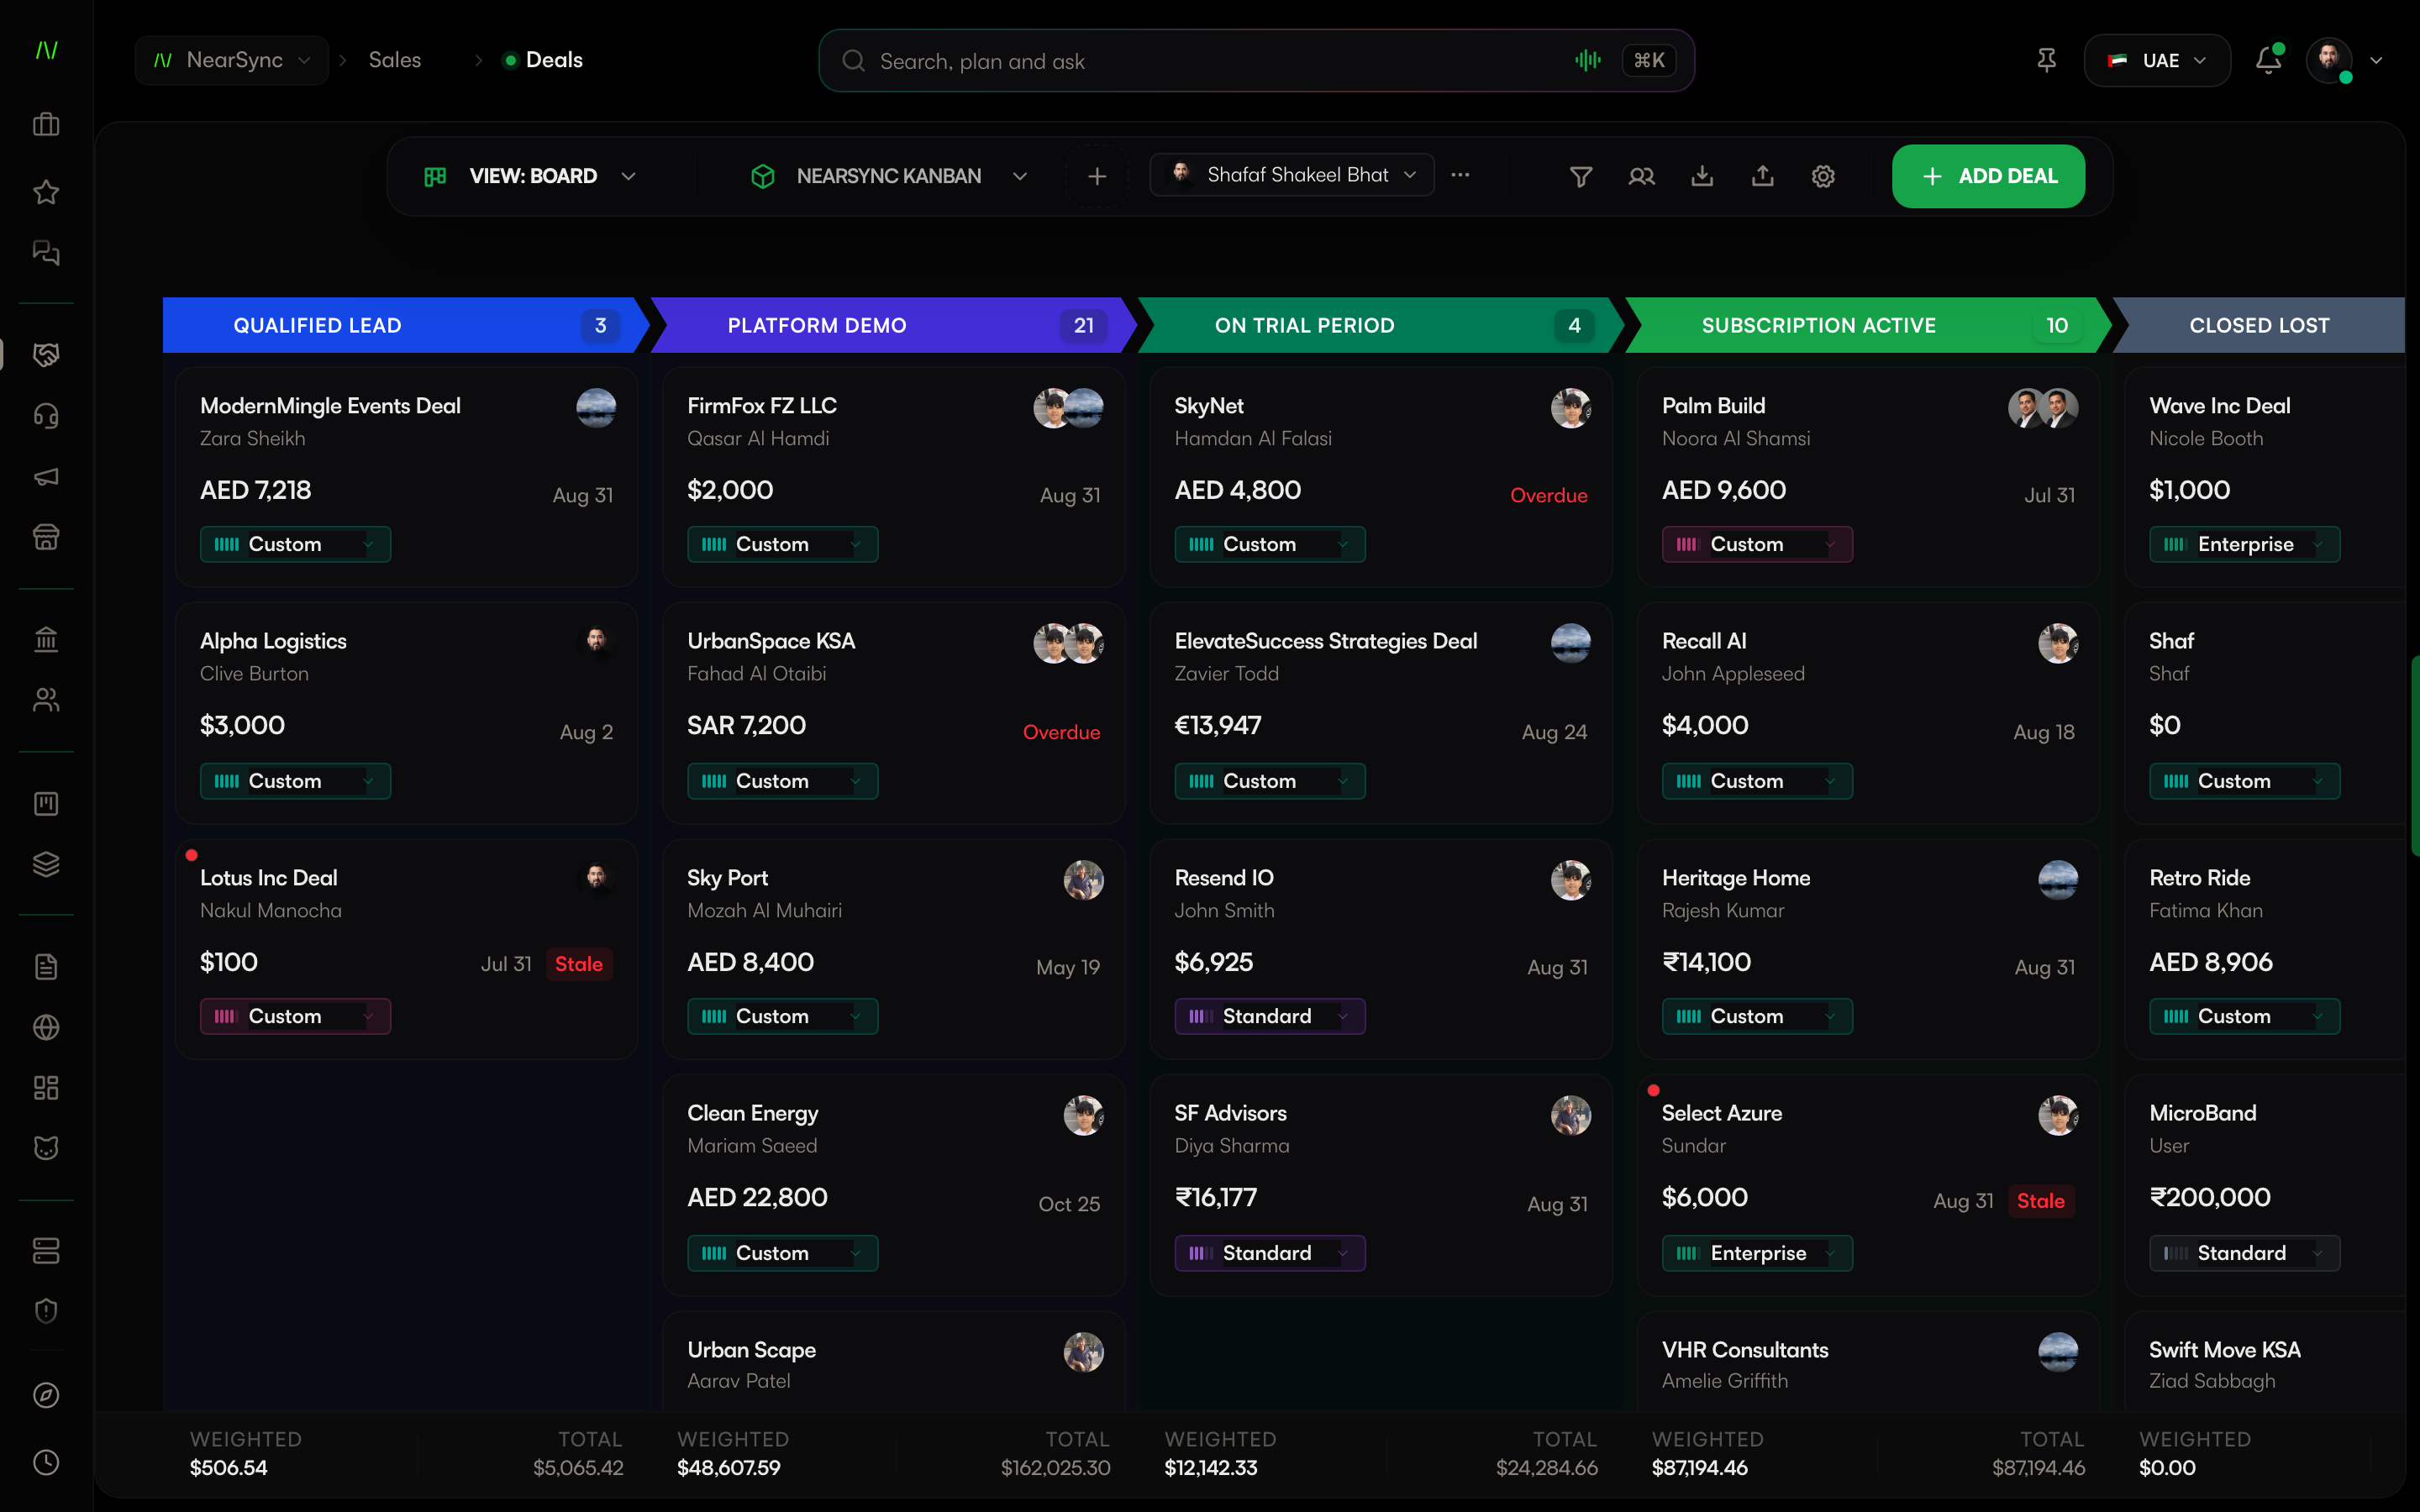
The Kanban view, and the one most people use daily. Your stages become columns and each deal is a card in the column matching its stage. The whole pipeline is visible at a glance.
What A Card Tells You
- The deal name, with the linked client or company underneath it
- The deal value, in the deal's own currency
- Who owns it, shown as an avatar top right, plus one collaborator if there is one
- The close date - or Overdue in red once that date has passed on an open deal
- A tier badge showing the package or pricing tier, with strength bars
- A stale marker: a dot top left, and a Stale chip beside the date
Moving A Deal
Drag the card from one column to the next. If the pipeline has governance rules, a move that breaks one is refused with the reason - see Pipeline Settings.
The Two Numbers At The Bottom
Each column shows a weighted forecast and a gross total, when Show Stage Totals is on in Pipeline Settings.
The gross is the raw sum of every deal in the stage. The weighted figure applies the probability set on that stage, so it reflects what you are actually likely to close.
The gap between those two numbers is the interesting part. A large gross with a small weighted total is a stage full of deals nobody believes in.
Watching For Stale Deals
Two separate things flag a deal that has stopped moving, and it is worth knowing which is which.
The badge on the card appears after 7 days with no update and turns severe after 20. The clock runs on when the deal was last touched, not on when it entered the stage. Closed deals never carry it: once a deal is won or lost the clock stops, because a Closed Lost card showing "Stale" tells you nothing.
The stage's own rot rule is separate and configurable - a number of days plus an action, set per stage in Pipeline Settings. That is where Notify Manager and Auto-move to Lost live.
Columns carrying several stale cards are where a forecast quietly rots - a deal untouched for 45 days is a completely different situation from a fresh one in the same column, and without the badge they look identical.
Table
Deals as rows, like a spreadsheet, one column per attribute. Use it to review many deals without opening each one, sort by value or stage, or export for a review.
Bulk Actions
Select any number of deals with the row checkboxes and apply one action to all of them:
- Assign Stage - move them all to a specific stage
- Assign Owner - reassign them to a different team member
- Assign Pipeline - move them into a different pipeline entirely
- Delete - remove them permanently
Caution
Delete cannot be undone. If you are not certain deals should go, use Assign Pipeline to move them into the Passive pipeline instead. The data survives, and your active pipeline stops being cluttered by them.
Bulk actions apply only to the pipeline you are currently viewing, and the current pipeline is always named in the toolbar. Check it before selecting a hundred rows.
List
A compact Board. Deals appear as cards in a vertical list rather than in columns, each showing the name, tier, client email, a short note, the value and the stage.
Good for scrolling a filtered set when you do not need the Kanban layout. Some people prefer it for a morning review before switching to the Board to work.
Graph
Deals as a network of connected nodes. Each deal is a dot linked to its company, sized by value and coloured by stage.
Not an everyday view, but it answers questions the others cannot. A dense cluster around one company tells you that organisation is a larger part of your pipeline than any single deal suggests - useful before a renewal conversation. It is also the fastest way to see deals floating with no company attached at all, which is usually a data problem worth fixing.
Filtering
The filter button narrows any view, and conditions combine. You might show deals over a certain value, owned by one person, closing this month.
The common ones are there as you would expect - amount, close date, owner, stage, lead source, industry, currency, status and create date.
Filter By Anything
The more useful thing is that filtering is not a fixed list. It runs against the database, so any property on a deal is a filter, including the custom fields you added to that pipeline yourself. If you created a field, you can filter and report on it the day you create it.
Each property is typed, and the operators follow from the type:
| Property type | Operators |
|---|---|
| Text | is, is not, contains, does not contain, starts with, is empty, is not empty |
| Number and currency | equals, not equals, greater than, less than, at least, at most, between |
| Date | is, before, after, between, in the last, in the next |
| Select and multi-select | is any of, is none of |
| Yes/no | is true, is false |
| Person | is, is not |
"In the last" and "in the next" are the ones worth knowing. A filter of close date in the next 14 days stays correct tomorrow, where a fixed date range quietly goes stale.
Saved Views
A set of conditions can be saved as a view and reopened later. That is how a weekly pipeline review stops being someone rebuilding the same six filters every Monday, and how two people looking at "at-risk enterprise deals" are looking at the same thing.
Which View, When
| You want to | Use |
|---|---|
| Work your day, move deals along | Board |
| Update or reassign many deals at once | Table |
| Skim a filtered set quickly | List |
| See account concentration, or find orphans | Graph |
Common Questions
Does switching view change anything about my deals? No. All four read the same data. A filter you set carries between them.
Why is a deal missing from the Board? Almost always a filter left on from earlier. Clear the filters and check the pipeline named in the toolbar is the one you expect.
Did this answer your question?
No, ask a person